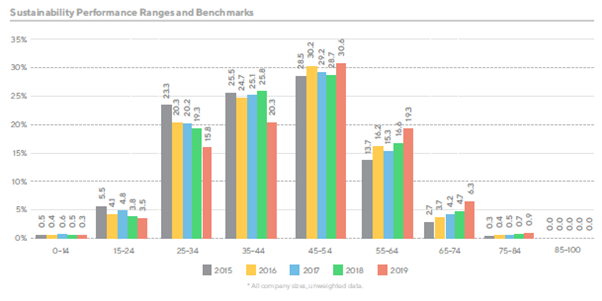
Bar chart showing sustainability performance percentages by range for years 2015 to 2019. Highest concentration is in the 45-54 range, peaking in 2017 and 2018. Lower percentages are seen in the highest and lowest ranges.

Bar chart showing sustainability performance percentages by range for years 2015 to 2019. Highest concentration is in the 45-54 range, peaking in 2017 and 2018. Lower percentages are seen in the highest and lowest ranges.