What do the cities of Hamburg (Germany) and Lagos (Nigeria) have in common? Not much, one might think. However, they share a property which makes them both vulnerable to climate change: they both lie at a height of only five meters above sea level – and the sea level rises every year.
How would it look like, a world with six-meter higher sea levels? You can now find it out yourself at http://flood.firetree.net/.
A natural phenomenon which has been increasing in the 20th century
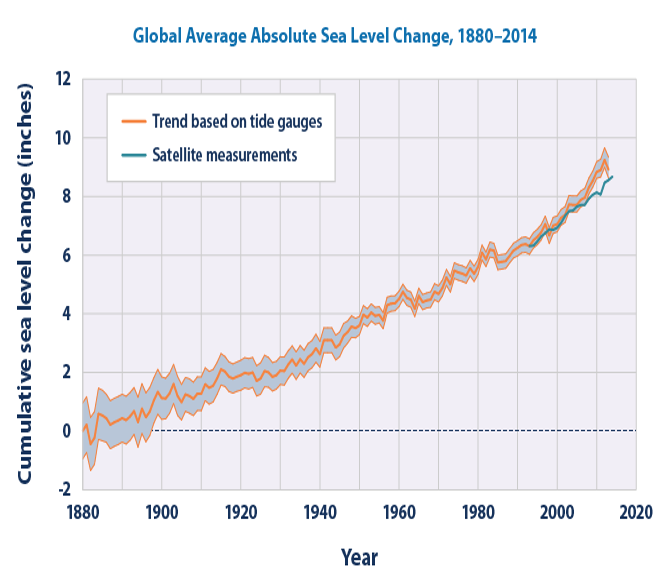
 Data from sediments, tide gauge records and satellites show that sea levels changed only little between 0 AD and 1900, but began rising in the 20th century[1]. Two main mechanisms have been identified to be responsible for this, both related to climate change:
- Water expands along with temperature; as global temperatures are rising, the water body’s volume is expanding
- Warmer temperatures initiate a thawing of the polar ice caps. The resulting melting water leads to higher sea levels
The average change rate was at about 1.7 mm per year in the last century, which amounts to a total difference of about 19 cm over the last 110 years. 19 cm – this is far from the five meters of Hamburg and Lagos, so no reason to worry? Well, far from it, unfortunately.
At the one hand, the increase rate is accelerating: between 1993 and 2010, it amounted already to 3.2 mm per year[2], which is a drastic increase compared to the values for the preceding century. Researchers from several universities just published a study stating that the 20th-century rise happened faster than any of the previous 27 centuries[3].
And secondly, we haven’t talked about tipping points yet.
Tipping points: when changes become rapid
Tipping points are maybe the biggest headache of climate scientists. This notion refers to a moment when the earth’s entire climatic system changes rapidly and irreversibly into a new state, triggered by a preceding constant change of an input variable (like the atmospheric CO2 level). Regarding sea level rise, such a tipping point might be reached once the Greenland ice sheet begins to thaw – research suggests that this could happen already with a global warming of about 1.6 degrees[4]. Greenland’s ice sheet is 3.000 meters thick; its melting would contribute to a total sea level rise of about 6 meters[5], with the well-known consequences not only for Hamburg or Lagos: About 10% of the world population live in low-lying areas, and 30% live in areas impacted by extreme flooding events. The majority of megacities is located in coastal areas[6].
On a human timescale, processes like the Greenland melting would still happen slowly, taking several thousand years. But if greenhouse gas emissions are not effectively limited, these processes are likely to accelerate. Due to a combination with increasingly frequent and severe rainstorms (also a consequence of climate change) huge investments into coastal protection will be necessary in the coming decades[7].
Thus, sea level rise does not just concern some lost islands somewhere in the ocean – it concerns the livelihoods of a substantial part of the world population. A worldwide and concerted action to mitigate climate change is crucial, if we want to ensure that our coastal areas can stay habitable for future generations. The UN Climate Conference in Paris 2015 has shown that a lot of governmental and private actors are willing to combat climate change – now the decisions made have to come into action.
DFGE can assist also your organization in quantifying your carbon emissions, and to establish a strategy to tackle them. Contact us at or +49.8192.99733-20 for more information.
Sources:
[1] http://oceanservice.noaa.gov/facts/sealevel.html
[2] http://www.ipcc.ch/pdf/assessment-report/ar5/wg1/WG1AR5_Chapter03_FINAL.pdf
[3] https://www.washingtonpost.com/news/energy-environment/wp/2016/02/22/seas-are-now-rising-faster-than-they-have-in-2800-years-scientists-say/?postshare=421456172051268&tid=ss_tw
[4] https://www.pik-potsdam.de/news/press-releases/archive/2012/gronlands-eismassen-konnten-komplett-schmelzen-bei-1-6-grad-globaler-erwarmung
[5] https://nsidc.org/cryosphere/quickfacts/icesheets.html
[6] http://www.uni-kiel.de/pressemeldungen/?pmid=2015-085-klimawandel
[7] https://www.gov.uk/government/publications/2010-to-2015-government-policy-flooding-and-coastal-change/2010-to-2015-government-policy-flooding-and-coastal-change
image source: https://upload.wikimedia.org/wikipedia/commons/6/65/Trends_in_global_average_absolute_sea_level%2C_1880-2013.png


