

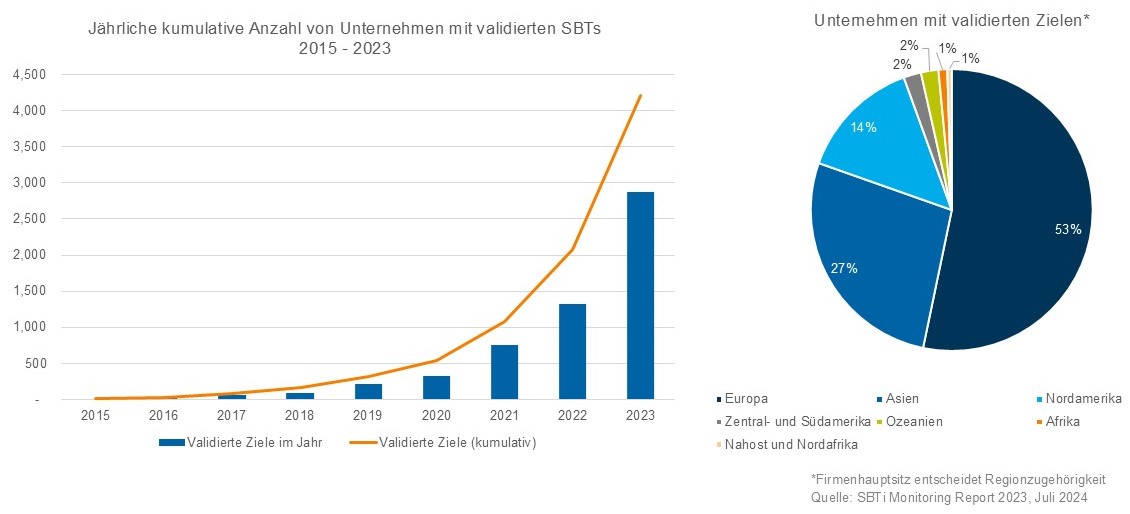
Bar chart showing a sharp rise in companies with validated SBTs from 2015 to 2023, and a pie chart showing most are in Europe (61%), followed by Asia (14%), then North America (14%), and smaller shares in other regions.
Bar chart showing a sharp rise in companies with validated SBTs from 2015 to 2023, and a pie chart showing most are in Europe (61%), followed by Asia (14%), then North America (14%), and smaller shares in other regions.