A dotted world map with a purple circle stating: Supply chain emissions are on average 11.4 times larger than direct emissions from operations. A CO2e cloud icon appears on the left.

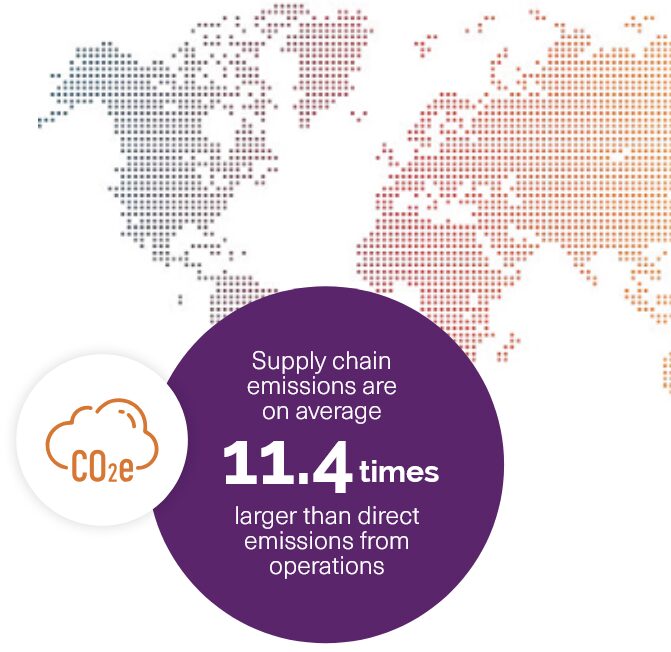
A dotted world map with a purple circle stating: Supply chain emissions are on average 11.4 times larger than direct emissions from operations. A CO2e cloud icon appears on the left.