

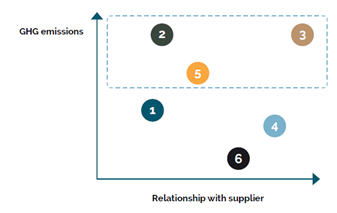
Scatter plot with six numbered circles showing GHG emissions on the y-axis and relationship with supplier on the x-axis; circles are spread across the chart, with four inside a dashed box.
Scatter plot with six numbered circles showing GHG emissions on the y-axis and relationship with supplier on the x-axis; circles are spread across the chart, with four inside a dashed box.