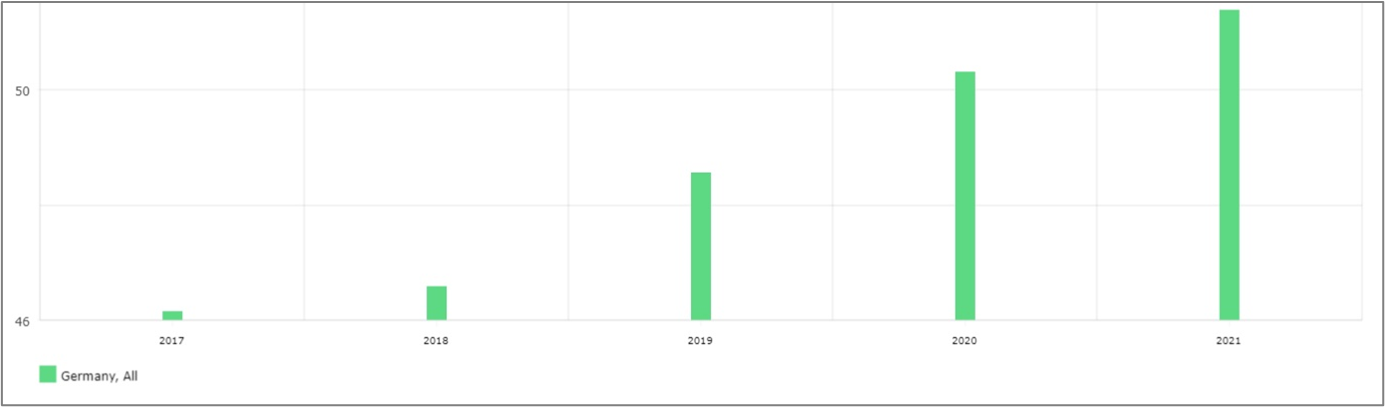
Bar chart showing growth in an unspecified value for Germany from 2017 to 2021, with steady increases each year and the highest value in 2021. The y-axis ranges from 46 to 52.

Bar chart showing growth in an unspecified value for Germany from 2017 to 2021, with steady increases each year and the highest value in 2021. The y-axis ranges from 46 to 52.