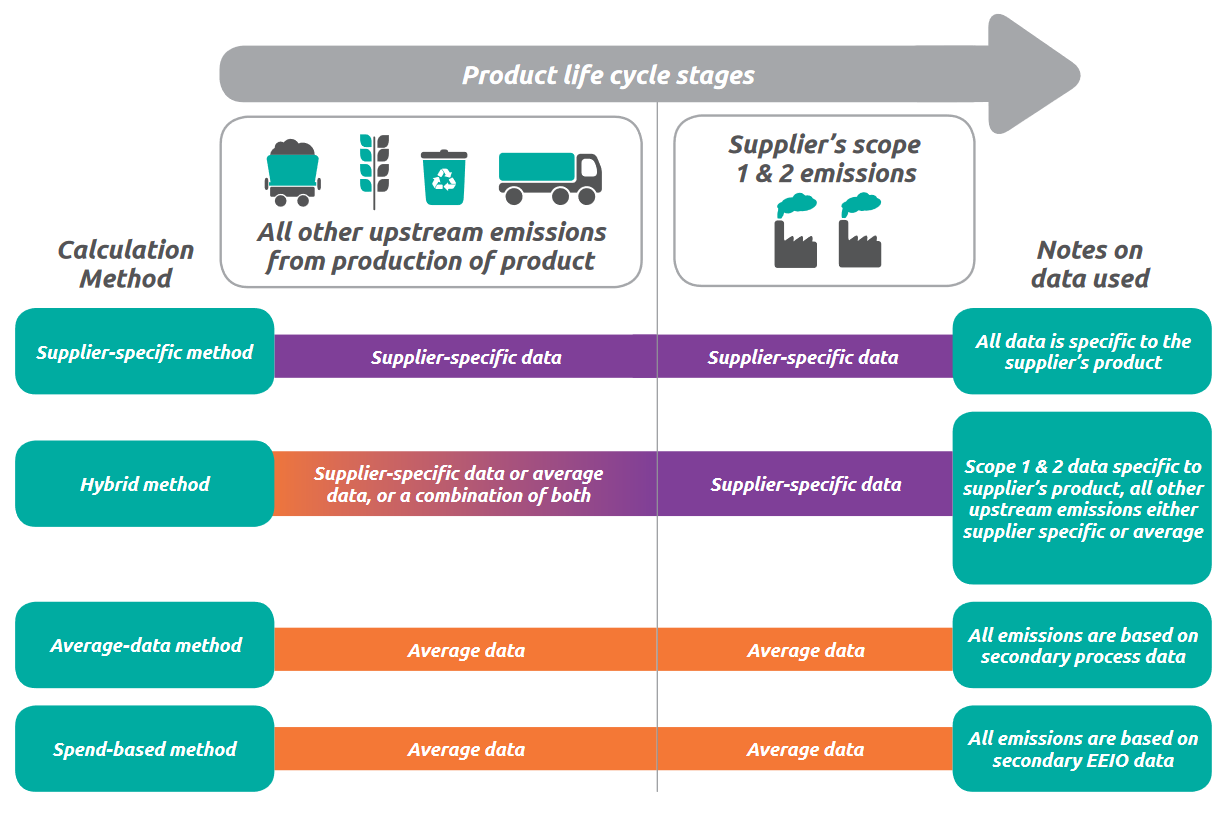
A chart compares calculation methods for supplier emissions: Supplier-specific, Hybrid, Average-data, and Spend-based. It shows which product life cycle stages and data types each method uses, with color-coded bars and icons.

A chart compares calculation methods for supplier emissions: Supplier-specific, Hybrid, Average-data, and Spend-based. It shows which product life cycle stages and data types each method uses, with color-coded bars and icons.